
 Say you wanted to describe someone you see on the street. You might characterize their sex, age, height, weight, build, complexion, face shape, hair, mouth and lips, eyes, nose, tattoos, scars, moles, and birthmarks. Then there’s clothing, behavior, and if you’re close enough, speech, odors, and personality. Your description might be different if you’re talking to a friend or a stranger, of the same or different sex and age. Those are a lot of characteristics and they’re sometimes hard to assess. Individual characteristics aren’t always relevant and can change over time. And yet, without even thinking about it, we describe people we see every day using these characteristics. We do it mentally to remember someone or overtly to describe a person to someone else. It becomes second nature because we do it all the time.
Most people don’t describe sets of numbers very often, though, so they don’t know how easy it actually is. You have to consider only a few characteristics, all of which are fairly easy to assess and will never change for the dataset. Once you learn how, it’s hardly a challenge to get it right, unlike describing the hot young guy who just robbed a bank wearing a clown costume.
What’s involved in describing a dataset? First, before considering any descriptive statistics, you have to assess two qualities.
- Phenomenon and population or sample
- Measurement scale
From this information, you’ll be able to determine what descriptive statistics to calculate.
Phenomenon and Population or Sample
This is a thinking exercise; there are no calculations.
First, determine what the numbers represent. What is the phenomenon they are related to? If there’s no context for the numbers, like it’s just a dataset for a homework problem, that’s fine too. But if you know something about the data, you might be able to judge whether your answer makes sense later when the calculations are done.

Next, think about the population from which the data were obtained. How is the population defined? Do you have all the possible measurements or entities? If not, you have a sample of the population, hopefully a sample that is a good representation of the population. This knowledge will help you judge whether your answer makes sense and will be consistent with other samples taken from the same population. Again, if there’s no context for the numbers, that’s fine. Now, all you have to decide is whether you want to describe the population or just the sample of the population for which you have measurements. If you’re not sure, assume you want to describe the population. All the fun stuff in statistics involves populations.
Measurement Scale

Scales of measurement express the phenomenon represented by the population. Simply put, scales are the ways that a set of numbers are related to each other. For example, the increments between scale values may all be identical, such as with heights and weights, or vary in size, such as with earthquake magnitudes and hurricane categories. The actual values of scales are called levels.
You have to understand the scale of measurement to describe data. There are a variety of types of measurement scales, but for describing a dataset you only need to pick from three categories:
- Grouping Scales – Scales that define collections having no mathematical relationship to each other. The groups can represent categories, names, and other sets of associated attributes. These scales are also called nominal scales. They are described by counts and statistics based on counts, like percentages.
- Ordered Scales – Scales that define measurement levels having some mathematical progression or order, commonly called ordinal scales. Data measured on an ordinal scale are represented by integers, usually positive. Counts and statistics based on medians and percentiles can be calculated for ordinal scales.
- Continuous Scales – Scales that define a mathematical progression involving fractional levels, represented by numbers having decimal points after the integer. These scales may be called interval scales or ratio scales depending on their other properties. Any statistic can be calculated for data measured on continuous scales.
There are other scales of measurement but that’s all you’ll need at this point.
Descriptive Statistics
Now you can get on to describing a set of numbers. You’ll only need to consider four attributes – frequency, central tendency, dispersion, and shape.
Frequency refers to the number of times the level of a scale appears in a set of numbers. It is used mostly for nominal (grouping) scales and sometimes with ordinal scales. The level with the highest frequency is called the mode. Frequency is used most effectively to show how scale levels compare to each other, such as with percentages or in a histogram.

Central Tendency refers to where the middle of a set of numbers is. It is used mostly for continuous (interval or ratio) scales and often with ordinal scales. There are many statistics that may be used to describe where the center of a dataset is, the most popular of which are the median and the mean. The median is the exact center of a progression-scale dataset. There are exactly the same number of data values less than and greater than the median. You determine the median by sorting the values in the dataset and counting the values from the extremes until you find the center. The mean, or average, is the center of a progression-scale dataset that is determined by a calculation. There may not be an equal number of data values less than and greater than the mean. You determine the mean by adding all the values in the dataset and dividing that sum by the number of values. The mean or the median is used in most statistical testing to find differences in data populations.
Dispersion refers to how spread out the data values are. It is used for continuous (interval or ratio) scales but only rarely with ordinal scales. There are many ways to describe data dispersion but the most popular is the standard deviation. You calculate the standard deviation by:
- Subtracting the mean of a dataset from each value in the dataset
- Squaring each subtracted value
- Adding all the squared values
- Dividing the sum of the squared values by the number of values in the dataset (if you’re describing a sample) or by the number of values in the dataset minus 1 (if you’re describing a population).
The standard deviation is used in statistical testing to find differences in data populations.
 Shape refers to the frequency of the values in a dataset at selected levels of the scale, most often depicted as a graph. For ordinal scales, the graph is usually a histogram. For continuous scales, the graph is usually a probability plot, although sometimes histograms are used. Shapes of continuous scale data can be compared to mathematical models (equations) of frequency distributions. It’s like comparing a person to some well-known celebrity; they’re not identical but are similar enough to provide a good comparison. There are dozens of such distribution models, but the most commonly used is the normal distribution. The normal distribution model has two parameters – the mean and the standard deviation.
There are many other statistics that can be used to describe datasets, but most of the time, this is all you need:
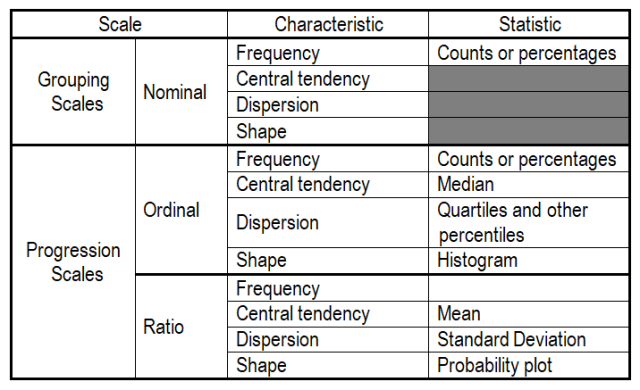
For example, a nominal-scale dataset would be described by providing counts or percentages of observations in each group. An ordinal-scale dataset would be described by providing counts or percentages for each level, the median and percentiles, and ideally, a histogram. A continuous-scale dataset would be described by providing the closest distribution model and estimates of its parameters, such as “normally distributed with a mean of 10 and a standard deviation of 2.” Continuous-scale datasets can be described so succinctly because the distribution-shape specification contains so much of the telling information.
Now isn’t that a lot easier than describing that hot bank robber wearing a clown costume?

Read more about using statistics at the Stats with Cats blog. Join other fans at the Stats with Cats Facebook group and the Stats with Cats Facebook page. Order Stats with Cats: The Domesticated Guide to Statistics, Models, Graphs, and Other Breeds of Data analysis at amazon.com, barnesandnoble.com, or other online booksellers.


Pingback: How to Describe Numbers | Hypergeometric
Definitly, explore those descriptives!
Pingback: Dare to Compare – Part 1 | Stats With Cats Blog
Pingback: WHAT TO LOOK FOR IN DATA – PART 1 | Stats With Cats Blog