
 Part 1 of Dare to Compare summarized several fundamental topics about statistical comparisons.
Statistical comparisons, or statistical tests as they are usually called, involve populations, groups of individuals or items having some fundamental commonalities. The members of a population also have one or more characteristics, called phenomena, which are what is compared in the populations. You don’t have to measure the phenomena in every member of the population. You can take a representative sample. Statistical tests can involve one population (comparing a population phenomenon to a constant), two populations (comparing a population phenomenon the phenomenon in another population), or three or more populations. You can also compare just one phenomenon (called univariate tests) or two or more phenomena (called multivariate tests).
Parametric statistical tests compare frequency distributions, the number of times each value of the measured phenomena appears in the population. Most tests involve the Normal distribution in which the center of the distribution of values is estimated by the average, also called the mean. The variability of the distribution is estimated by the variance or the standard deviation, the square root of the variance. The mean and standard deviation are called parameters of the Normal distribution because they are in the mathematical formula that defines the form of the distribution. Formulas for statistical tests usually involve some measure of accuracy (involving the mean) divided by some measure of precision (involving the variance). Most statistical tests focus on the extreme ends of the Normal distribution, called the tails. Tests of whether population means are equal are called non-directional, two-sided, or two-tailed tests because differences in both tails of the Normal distribution are considered. Tests of whether population means are less then or greater then are called directional, one-sided, or one-tailed tests because the difference in only one tail of the Normal distribution is considered.
 Statistical tests that don’t rely on the distributions of the phenomenon in the populations are called nonparametric tests. Nonparametric tests often involve converting the data to ranks and analyzing the ranks using the median and the range.
The nice thing about statistical comparisons is that you don’t have to measure the phenomenon in the entire population at the same place or the same time, and you can then make inferences about groups (populations) instead of just individuals or items. What may even be better is that if you follow statistical testing procedures, most people will agree with your findings.
Now for even more …
Process
There are just a few more things you need to know before conducting statistical comparisons.
You start with a research hypothesis, a statement of what you expect to find about the phenomenon in the population. From there, you create a null hypothesis that translates the research hypothesis into a mathematical statement about the opposite of the research hypothesis. Statistical comparisons are sometimes called hypothesis tests. The null hypothesis is usually also written in term of no change or no difference. For example, if you expect that the average heights of students in two school districts will be different because of some demographic factors (your research hypothesis), then your null hypothesis would be that the means of the two populations are equal.
 When you conduct a statistical test, the result does not mean you prove your hypothesis. Rather, you can only reject or fail to reject the null hypothesis. If you reject the null hypothesis, you adopt the alternative hypothesis. This would mean that it is more likely that the null hypothesis is not true in the populations. If you fail to reject the null hypothesis, it is more likely that the null hypothesis is true in the populations.
The results of statistical tests are sometimes in error, but fortunately, you have some control over the rates at which errors occur. There are four possibilities for the results of a statistical test.
- True Positive – The statistical test fails to reject a null hypothesis that is true in the population.
- True Negative – The statistical test rejects a null hypothesis that is false in the population.
- False Positive – The statistical test rejects a null hypothesis that is true in the population. This is called a Type I error and is represented by α. The Type I error rate you will accept for a test is called the Confidence. Typically the confidence is set at 0.05, a 5% Type I error rate, although sometimes 0.10 (more acceptable error) or 0.001 (less acceptable error) are used.
- False Negative – The statistical test fails to reject a null hypothesis that is false. This is called a Type II error and is represented by β. The ability of a particular comparison to avoid a Type II error is represented by 1-β and is called the Power of the test. Typically, power should be at least 0.8 for a 20% Type II error rate.
When you design a statistical test, you specify the hypotheses including the number of populations and directionality, the type of test, the confidence, and the number of observations in your representative sample of the population. From the sample, you calculate the mean and standard deviation. You calculate the test statistic and compare it to standard values in a table based on the distribution. If the test statistic is greater than the standard value, you reject the null hypothesis. When you reject the null hypothesis the comparison is said to be significant. If the test statistic is less than the standard value, you fail to reject the null hypothesis and the comparison is said to be nonsignificant. Most statistical software now provide exact probabilities, called p-values, that the null hypothesis is false so no tables are necessary.
 After you conduct the test, there are two pieces of information you need to determine – the sensitivity of the test to detect differences, called the effect size, and the power of the test. The power of the test will depend on the sample size, the confidence, and the effect size. The effect size also provides insight into whether the test results are meaningful. Meaningfulness is important because a test may be able to detect a difference far smaller than what might of interest, such as a difference in mean student heights less than a millimeter. Perhaps surprisingly, the most common reason for being able to detect differences that are too small to be meaningful is having too large a sample size. More samples are not always better.
Tests
It seems like there are hundreds of kinds of statistical tests, and in a way there are, but most are just variations of the concept of the accuracy in terms of the precision. In most tests, you calculate a test statistic and compare it to a standard. If the test statistic is greater than the standard, the difference is larger than might have been expected by chance, and is said to be statistically significant. For the most part, statistical software now reports exact probabilities for statistical tests instead of relying on manual comparisons.
Don’t worry too much about remembering formulas for the statistical tests (unless a teacher tells you to). Most testing is done using software with the test formulas already programmed. If you need a test formula, you can always search the Internet.
Tests depend on the scales of the data to be used in the statistical comparison. Usually, the dependent variable (the measurements of the phenomenon) is continuous and the independent variable (the divisions of the populations being tested) is categorical for parametric tests. Sometimes there are also grouping variables used as independent variables, called effects. In advanced designs, continuous-scale variables used as independent variables are called covariates. Some other scales of measurement for the dependent variable, like binary scales and restricted-range scales, requires special tests or test modifications.
Here are a few of the most common parametric statistical tests.

 z-Tests and t-Tests
The z-test and the t-test have similar forms relating the difference between a population mean and a constant (one-population test) or two population means (two-population test) to some measure of the uncertainty in the population(s). The difference in the tests is that a z-test is for Normally distributed populations where the variance is known and t-tests are for populations where the variance is unknown and must be estimated from the sample. t-Tests depend on the number of observations made on the sample of the population. The greater the sample size, the closer the t-test is to the z-test. Adjustments of two-population t-tests are made when the sample sizes or variances are different in the two populations. These tests can also be used to compare paired (e.g., before vs after) data.
ANOVA F-Tests
Unlike t-tests that are calculated from means and standard deviations, F-tests are calculated from variances. The formula for the one-way ANOVA F-test is:
- F = explained variance / unexplained variance, or
- F = between-group variability / within-group variability, or
- F = Mean square for treatments / Mean square for error
These are all equivalent. Also, as it turns out, F = t2.
 χ2 Tests
The chi-squared test is used to determine whether there is a significant difference between the expected frequencies and the observed frequencies in mutually exclusive categories of a contingency table. The test statistic is the square of the observed frequency minus the expected frequency divided by the expected frequency.
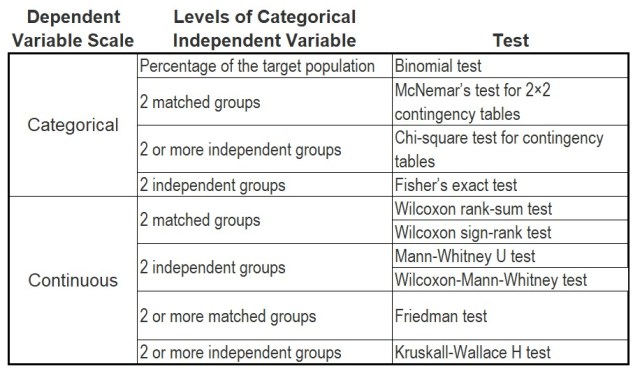
Nonparametric Tests
Nonparametric tests are also called distribution-free tests because they don’t rely on any assumptions concerning the frequency distribution of the test measurements. Instead, the tests use ranks or other imposed orderings of the data to identify differences. Here are a few of the most common nonparametric statistical tests.

Assumptions
You make a few assumptions in conducting statistical tests. First you assume your population is real (i.e., not a phantom population) and that your samples of the population are representative of all the possible measurements. Then, if you plan to do a parametric test, you assume (and hope) that the measurements of the phenomenon are Normally distributed and that the variances are the same in all the populations being compared. The closer these assumptions are met, the more valid are the comparisons. The reason for this is that you are using Normal distributions, defined by means and variances, to represent the phenomenon in the populations. If the true distributions of the phenomenon in the populations do not exactly follow the Normal distribution, the comparison will be somewhat in error. Of course, the Normal distribution is a theoretical mathematical distribution so there is always going to be some deviation from it and real world data. Likewise with variances in multi-population comparisons. Thus, the question is always how much deviation from the assumptions is tolerable before the test becomes misleading.
Data that do not satisfy the assumptions can often be transformed to satisfy the assumptions. Adding a constant to data or multiplying data by a constant does not affect statistical tests, so transformations have to be more involved, like roots, powers, reciprocals, and logs. Box-Cox transformations are especially useful but are laborious to calculate without supporting software. Ultimately, ranks and nonparametric tests can be used in which there is no assumption about the Normal distribution.
Next, we’ll see how it all comes together …
Read more about using statistics at the Stats with Cats blog. Join other fans at the Stats with Cats Facebook group and the Stats with Cats Facebook page. Order Stats with Cats: The Domesticated Guide to Statistics, Models, Graphs, and Other Breeds of Data analysis at amazon.com, barnesandnoble.com, or other online booksellers.


Comprehensive summary much!