
Four things to look for.

Why People Hate Polls
It’s probably true that everybody has taken a survey at some point or other. What’s also probably true is that most people think polling is easy. And why not? Google has a site for creating polls. Social media sites and blogging sites provide capabilities for conducting polls. There are also quite a few free online survey tools. Why wouldn’t people believe that just anybody could conduct a survey.
Perhaps as a consequence of do-it-yourself polling, there is no end to truly bad, amateur polls. But, there are also well-prepared polls meant to mislead, some overtly and some under the guise of unbiased research. Some people have accordingly come to believe that information derived from all polls is biased, misleading or just plain useless. Familiarity breeds contempt.
Like any other complex practice like medicine, statistical polling isn’t an exact science and can unexpectedly and unintentionally fail. But for the most part, it is legitimate and reliable even if the public doesn’t understand it. However, ignorance breeds contempt too.
Ignorance leads to fear and fear leads to hate.
People are comfortable with polls that confirm their preconceived notions, confirmation bias, yet they lambaste polls that don’t confirm their beliefs because they don’t understand the science and mathematics behind statistical surveying. This is experienced equally by both sides of the political spectrum. Nonetheless, surveys are relied on extensively throughout government and business to support their work. And, of course, politicians live and die by poll results.
Poll haters usually focus on six kinds of criticisms:
- The results were decided before the poll was conducted.
- The poll only included 1,000 people out of 300,000,000 Americans
- The results should only apply to the people questioned
- The poll didn’t include me
- The poll only interviewed subjects who had landlines
- The poll didn’t ask fair questions
I didn’t make these criticisms up. I compiled them from Twitter threads that involved political polls. I explain why these criticism might be correct or not at the end of the article.
If you want to assess whether a political poll really is legitimate, there are four things you should look at. It helps if you know some key survey concepts, including population, frame, sample and sample size, interview methods, question types, scales, and demographics. If you do, skip to the last section of this article for the hints. Otherwise, read on.
Critical Elements of Surveys
The terms poll and survey are often used synonymously. Traditionally, polls were simple, one-question, interviews often conducted in person. Surveys were more elaborate, longer, data gathering efforts conducted with as much statistical rigor as possible. Political “who-do-you-plan-to-vote-for” polls have evolved into expansive instruments to explore preferences for policies and politicians. You can blame the evolution of computers, the internet, and personal communications for that.
Polls on social media are for entertainment. Serious surveys of political preferences are quite different. There is a lot that goes into creating a scientifically valid survey. Scores of textbooks have been written on the topic. Furthermore, the state-of-the-art is constantly improving as technology advances and more research on the psychology of survey response is conducted.
Here are a few critical considerations in creating surveys.
Survey Source
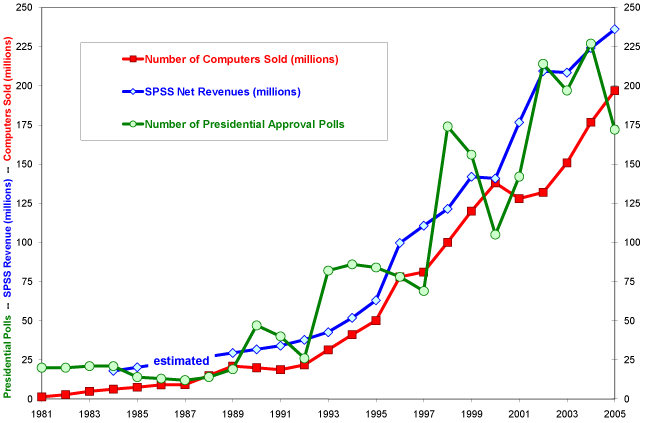
As you might expect, the source of a political survey is important. Before 1988, there were on average only one or two presidential approval polls conducted per month. Within a decade, that number had increased to more than a dozen. By 2021, there were 494 pollsters who conducted 10,776 political surveys. Fivethirtyeight.com graded 93% of the pollsters with a B or better; 2% failed. Of the pollsters, two-fifths lean Republican and three-fifths lean Democratic. Notable Republican-leaning pollsters include: Rasmussen; Zogby; Mason-Dixon; and Harris. Notable Democratic-leaning pollsters include: Public Policy Polling; YouGov; University of New Hampshire; and Monmouth University.
Topics
The topics of a political survey are simply what you want to know about certain policies, events, or individuals. Good surveys define what they mean by the topics they are investigating and do not push biases and misinformation. They account for the relevance, changeability, and controversiality of the topic in the ways they organize the survey and ask the questions.
Population
The population for a survey is the group to which you want to extrapolate your findings. For political surveys in the U.S., the population of a survey is simply the population of the country, or at least the voters. The Census Bureau provides all the information on the demographics (e.g., gender, age, race/ethnicity, education, income, party identification) of the country that surveys need.
Frame
The frame is a list of subjects in the population that might be surveyed. Frames are more difficult to assemble than population characteristics because the information sources are more diverse and not centralized. Sources might include telephone directories, voters lists, tax records, membership lists of public organizations, and so on.
Sample
The survey sample is the individuals to be interviewed. More individuals are needed than the number of samples desired for the survey because some individuals will decline to participate. The sample is usually selected from the frame by some type of probability sampling. Usually, stratified-random sampling is used to ensure all the relevant population demographics are adequately represented. This establishes survey accuracy.
Getting the population, frame, and sample right is the most fundamental aspect of a survey that can go wrong. Professional statisticians agonize over it. When something goes wrong, it’s the first place they look because everything else is pretty straightforward. Sometimes identifying problems in surveys is near impossible.
Sample Size
Sample size is simply the number of individuals who respond to the survey. Sample size (and a few other survey characteristics) determine the precision of the results. One of the first things critics of political polls cite is how few subjects are interviewed. A challenge in survey design is to select a large enough sample size to provide adequate precision yet not too many samples that would increase costs.
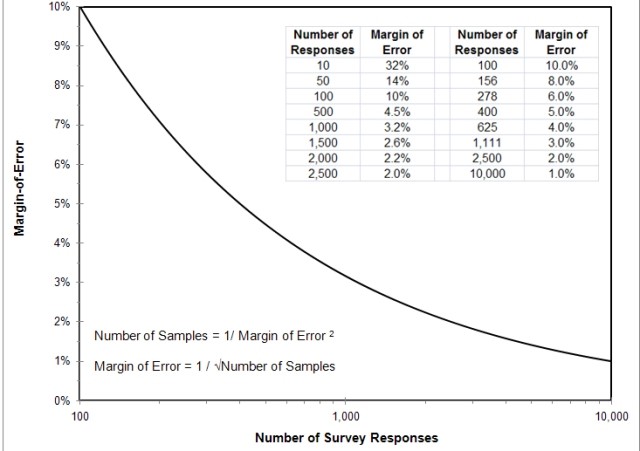
Most political polls use 500 to 1,500 individuals to achieve margins-of-error between .5% and 2.6%. (If you’ve taken Stats 101, the margin-of-error is the 95% confidence interval around an average survey response.) Using more than 1,500 individuals is expensive and doesn’t increase precision much (as shown in the chart).
Interview Methods
There are many methods used to provide questions to individuals in a survey, including: in-person, telephone, recorded message, mail and email, and websites. Each has its own advantages and limitations. Some surveys use more than one method in order to test the influence of the interview.
Questions
The questions that are included in a survey are often a focus of critics. The construction of survey questions is an arduous process involving eliciting information on a topic so to not influence the resulting answer. It sounds simple but to a professional survey designer, it seldom is. The structure of questions shouldn’t be vague, leading, or compound, nor should it employ double negatives. The choice of individual words is also important to ensure they do not introduce bias, are not offensive or emotion-laden, nor may be misleading, unfamiliar, or have multiple meanings. Jargon, slang, and abbreviations/acronyms are particularly taboo. Sometimes surveys have to be presented in different languages besides English depending on the frame. Questions also have to be designed to facilitate the analysis and presentation of results.
Types of Questions
Asking a question in plain conversation doesn’t require the rigor that is needed for survey questions. In a conversation, you can rephrase and follow-up when you don’t get an answer that can be used in an analysis. You don’t have that flexibility in a survey; you only get once chance. You have to construct each question so that respondents are forced to categorize their responses into patterns that can be analyzed. There are quite a few ways to do this.
Open Ended Questions
The most flexible type of question is the open-ended question, which has no predetermined categories of responses. This type of question allows respondents to provide any information they want, even if the researcher had never considered such a response. As a consequence, open-ended questions are notably difficult to analyze. They are almost never used in legitimate political polls.
Closed ended Questions
Closed-ended questions all have a finite number of choices from which the respondent has to select. There are many types of closed-ended questions, including the following eight.
1. Dichotomous Questions — either/or questions, usually presented with the choices yes or no.

Dichotomous questions are easy for survey participants to understand. Responses are easy to analyze. Results are easy to present. The drawback of dichotomous questions is that they don’t provide any nuances to participant answers.
2. Single-Choice Questions — a vertical or horizontal list of unrelated responses, sometimes presented as a dropdown menu. The responses are often presented in sequences that are randomized between respondents.

Single-choice questions are easy for survey participants to understand. Responses are easy to analyze. Results are easy to present. The drawback of single-choice questions is that they can’t always provide all the choices that might be relevant. In the sample question, for example, there are a lot more issues that a participant might think are more important than the seven listed.
3. Multiple-choice Questions — like a single choice question except that the respondent can select more than one of the responses. This presents a challenge for data presentation because percentages of responses won’t sum to 100%

Multiple-choice questions are somewhat more difficult for survey participants to understand because participants can check more than one response box. Survey software helps to validate the responses. Those responses are more difficult to analyze because it’s almost like having a dichotomous question for each response checkbox. Results are more difficult to present clearly because percentages can be misleading. The advantage of multiple-choice questions is that they provide some comparative information about the choices in an efficient way.
4. Ranking Questions — questions in which respondents are supposed to place an order on a list unrelated items.
Ranking questions are relatively easy for survey participants to understand but rank-ordering takes more thought than just picking a single response. Responses are much more difficult to analyze and present. The advantage of ranking questions is that they provide more comparative information about the choices than multiple-choice questions.
5. Rating Questions — questions in which respondents are supposed to assign a relative score on unrelated items. The score is on some type of continuous scale. Responses might be written in or indicated on a slider.

Rating questions are relatively easy for survey participants to understand, although anything requiring survey participants to work with numbers presents a risk of failure. Responses are easy to analyze and results are easy to present, though. The drawback of rating questions is that they take participants longer to respond to than Likert-scale questions.
6. Likert-scale Questions— like a single-choice question in which the choices represent an ordered spectrum of choices. An odd number of choices allows respondents to pick a middle-of-the-road position, which some survey designers avoid because it masks true preferences.

Likert-scale questions are easy for survey participants to understand. Responses are easy to analyze and present. The drawback of Likert-scale questions is that they are less precise than rating questions.
7. Semantic-differential Questions — like a Likert or rating scale question in which the choices represent a spectrum of preferences, attitudes, or other characteristics, between two extremes (e.g., agree-disagree, conservative-progressive, important-unimportant). It is thought to be easier for respondents to understand.

Semantic-differential questions are easy for survey participants to understand. Responses are easy to analyze once the responses are coded. Results are easy to present. The drawback of semantic-differential questions is that they are not supported by some survey software.
8. Matrix Questions — Questions that allow two aspects of a topic to be assessed at the same time. Matrix questions are very efficient but also too complex for some respondents.

Matrix questions are very efficient but also difficult for some survey participants to understand. Responses are easy to analyze and present because they are like multiple Likert-scale questions.
Issues with Questions
One common issue with questions in political surveys is constrained lists, in which only a few of many possible choices are provided. Then the results are presented as the only choices selected by respondents. This happens with multiple-choice, ranking, and matrix questions. For example, a survey might ask “what’s the most important issues facing the country?” with the only choices being “abortion,” “immigration,” “marriage,” and “election fraud,” and then reporting that Americans believe abortion is a major national issue. Constrained questioning is not soundly-acquired, legitimate survey information.
There are many other issues that question creators have to consider.
- It is preferable to construct questions similarly to facilitate respondent understanding.
- The types and complexities of the questions and the number of choices will influence the type of interview and the length of the survey.
- Long surveys suffer from participant drop-out. This may cause questions to have different precisions (because of different sample sizes) and even different demographic profiles.
- When questions are not answered by respondents, the missing data that must be considered in the analysis. Requiring answers is not a good solution because it may cause some respondents to leave the survey, worsening the drop-out rate.
- If the order of the questions or the order of the choices for each question may be influential, they should be randomized.
- Some questions may need an other option, which is difficult to analyze.
- Demographic questions must be included in the survey so that comparison to the population is possible.
- Interviewee anonymity must be preserved while still including demographic information.
- Focus groups, pilot studies, and simultaneous use of alternative survey forms are sometimes used for evaluating survey effectiveness.
Creating survey questions is not as simple as critics think it is.
How to Tell if a Political Poll is Valid
People criticize political polls all the time. Some criticisms are reasonable and valid based on flawed methods, and others are just a reflection of the poll results being different from what the critic believes. Critics fall on all sides of the political spectrum.
Six Criticisms of Poll Haters
Most people probably wouldn’t criticize, or for that matter, even care about political polls if they didn’t have preconceived notions about what the results should be. If they do see a poll that doesn’t agree with their preconceived notions, they are quick to find fault. Some of their criticisms could have merit, but usually not. Here are six examples.
Too Few Participants
Critics of political polls can’t seem to understand that a sample of only a few hundred individuals can be extrapolated to the whole population of the U.S., over 300 million, if the survey frame and sample are appropriate. What the number of survey participants does influence is the survey precision. So, this criticism would be true if the sample size were small, say less than 100. This would make the margin of error about ±10%, which would be fairly large for comparing preferences for two candidates. However, most legitimate political polls include at least 500 participants, making the margin of error about ±4.5%. Large political polls might include 1,500 participants resulting in a ±2.6% margin-of-error. This criticism is almost always unjustified.
They Didn’t Ask Me
If the survey frame and sample are appropriate, the demographic of the critic is already represented. This criticism is always unjustified.
The first political poll dates back to the Presidential election of 1824. Probability and statistical inference for other applications is hundreds of years older than that. The science behind extrapolating from a sample representative of a population to the population itself is well established.
This criticism is about the frustration a critic has when the survey results don’t match their expectations. It is a form of confirmation bias. The results just mean that the opinion of the critic doesn’t match the population.
Only Landline Users Were Interviewed
This criticism has to do with how technology affects the selection of a frame and a sample. The issue dates back to the 1930 and 1940s when telephone numbers were used to create frames. The problem was that only wealthy households owned telephones so the frame wasn’t representative of the population. Truman defeated Dewey regardless of what the polls predicted.
The issue repeated in the 1990s and 2000s when cell phones began replacing landlines. For that period, neither mode of telephony could be relied on to be representative of the U.S. population. By the 2010s, cell phone users were sufficiently representative of the population to be used as a frame.
Today, using telephone lists exclusively to create frames is a known issue. Most big political surveys use several different sources to create frames that are representative of the population.
They Asked the Wrong Questions
This criticism probably isn’t about gathering information about the wrong topics. It is probably critics thinking that the questions were biased or misleading in some ways. It’s probably true that this criticism is made without the critic actually reading the questions because that information is seldom available in news stories. It has to be uncovered in the original survey analysis report.
This criticism may have merit if the poll didn’t clearly define terms, or used slang or jargon. Professional statisticians usually ask simple and fair survey questions but may on occasion use vocabulary that is unfamiliar to participants.
The Results Were Predetermined
This is a bold criticism that isn’t all that difficult to invalidate. First, no professional pollster is likely to commit fraud, regardless of the reward, just because their business and career would be in jeopardy. Look at the source. If it is any nationally known pollster who has been around for a while, the criticism is unlikely.
If the source is an unknown pollster, look at the report on the survey methods. They might suggest poor methods but that wouldn’t necessarily guarantee a particular set of results. If there was an obvious bias in the methods, like surveying attendees at a gun show, it should be apparent.
If there is no background report available on the survey methods, this criticism would merit attention. In particular, if the survey results were prepared by a non-professional for a specific political candidate or party, skepticism would be appropriate.
The Results Are Wrong
There are many things that can go wrong with a survey. Criticisms that a political poll is wrong are usually suppositions based on confirmation bias. Compare the poll to other polls researching the same topics during the same timeframe. If the results are close, within the margins-of-error, the polls are probably legitimate.
Criticisms based on suspect survey methods are difficult to prove. The only way to determine that a political poll was truly wrong is to wait until after the election and conduct a post-mortem.
Even when a professional pollster designs a survey, unexpected results can occur. This was the case in the 1948 Presidential election. More recently, polls conducted before the 2016 Presidential election did not correctly predict the winner. New methods were put in place but the polls conducted before the 2020 election also had discrepancies. What polling organizations haven’t considered yet is that the polls were correct but voter suppression measures affected the results. In other words, the polls correctly predicted the intent of the electorate but voters could not express their preferences on election day because of administrative barriers.
Four Hints for Assessing Polls
Don’t get fooled into believing results you agree with or disbelieving results you don’t, called confirmation bias. Don’t get distracted by the number of respondents. You have to dig deeper to assess the legitimacy of a poll.
You won’t be able to tell from a news story if a poll is likely to be valid. You have to find a link to the documentation of the original poll. If there is none, search the internet for the polling organization, topic, and date. If there is no link to the poll, or if the link is dead or leads to a paywall, the legitimacy of the poll is suspect.
When you find the poll documentation, look for four things:
- Who conducted the poll? Are they independent, unbiased, and reputable? Try searching the internet and visiting https://projects.fivethirtyeight.com/pollster-ratings/. A poll conducted for a candidate or a political party is not likely to be totally legitimate.
- What was the progression from population to frame to sample? This is very difficult for non-statisticians to assess; it’s even difficult for statisticians to work out. It’s not just a matter of polling whoever answers a phone or visits a website. Participants have to be weighted for population demographics and cleared from any potential biases. In short, if the process is complex and described in detail, it is more likely to have been valid than not.
- Were the questions simple and unbiased? Was the sentence structure of the questions understandable? Were any confusing or emotion-laden words used? Did the questions directly address the topics of the survey? Were the questions presented in close-ended types so that the results were unambiguous? You have to actually see the questions documented in the survey analysis report to tell. Also, check to see how the interviews were conducted, whether autonomously or in person. It probably won’t matter. Sophisticated surveys might use more than one interview method and compare the results.
- Does it explore demographics? Any legitimate political survey will explore the background of the respondents, things like sex, age, race, party, income, and education. Researchers use this information to analyze patterns in subgroups of the sample. If the poll doesn’t ask about that information, it’s probably not legitimate.
There will always be something that might adversely affect the validity of a poll. Even professional statisticians make mistakes or overlook minor details. But, these glitches will probably be impossible for most readers to spot. If you as an average consumer see something in the population, frame, sample, or questions that is dubious, you may have cause to critique. Otherwise, don’t expose your ignorance by complaining about not having enough participants.
Learn how to think critically and make it your first reaction to any questionable poll you may encounter.


Pingback: Comprehensive, original, insightful, and otherwise interesting data science blogs – CTO News Hubb